ADVERTISEMENTS:
The runoff from a catchment is estimated by the following methods: 1. Standard Tables 2. Empirical Formulae 3. Rainfall Runoff Correlation.
Method # 1. Standard Tables:
Observations of precipitation and the resulting runoff were taken for a number of catchments having different characteristics. Tables are prepared showing the relation between precipitation and the resulting runoff, taking into consideration the catchments.
The following tables are in use:
ADVERTISEMENTS:
a. Binnie’s Table:
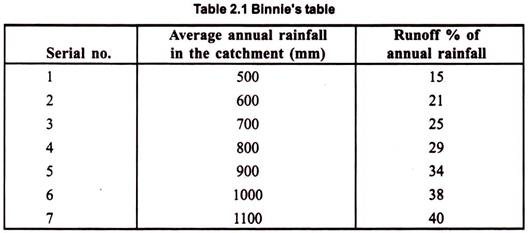
Sir Binnie suggested runoff as a percentage of total annual precipitation by observing rivers in Madhya Pradesh, India, as follows:
The observations were based on areas that were not having heavy rainfall but were having a precipitation up to 1100 mm. Hence, these percentages are not applicable for high-rainfall areas.
b. Rainfall-Runoff Correlation:
ADVERTISEMENTS:
Runoff = K × (Annual rainfall)
where K = Constant and its value for various types of catchment areas are shown in Table 7.2.
This method is applicable mainly to small urban catchment areas.
c. Strange’s Coefficient:
W.L. Strange suggested that rainfall-runoff relationship depends upon the nature of catchment as well as soil condition. The relation was developed on the basis of observations in the former Bombay State in India. The relation has been presented in the form of tables as well as curves.
The catchment is classified as:
(i) Dry,
(ii) Damp, and
(iii) Wet.
It is also classified as:
(a) Good,
(b) Average, and
ADVERTISEMENTS:
(c) Bad.
The percentage coefficients for these classifications are given in Table 2.3.
It was also recommended to add 25% to the runoff figures for good catchments and deduct 25% for the bad catchments. The precipitation range as well as the type of catchment is covered in this approach. Still the results are not accurate. The daily runoff is calculated whenever there is rain and is added to calculate the seasonal or annual runoff.
d. Barlow’s Method:
Barlow suggested percentage coefficients for small catchment areas depending on the nature of the catchment for different categories as given in Table 2.4.
These percentages were modified by multiplying them by a coefficient depending on the rainfall as given in Table. 2.5.
Method # 2. Empirical Formulae:
There are several empirical formulae in use.
These involve the following parameters:
a. Catchment area.
b. Annual rainfall.
c. Nature of catchment.
d. Average temperature.
The formulae normally followed are as follows:
i. Sir Inglis Formula:
Sir Inglis suggested two formulae, based on the observations in the former Bombay State, India.
(a) Ghat-Fed Catchments:
R = 0.85 P – 30.5
(b) Plain Areas in Water Shadow Regions:
where P and R are in cm.
A catchment area may be partly in the ghat and partly in the plains. Runoff from both the types may be calculated separately and then added together.
ii. Khosla’s Formula:
Dr. Khosla suggested the following formula:
R = P – 5T
where, R = Runoff in mm
P = Average precipitation in mm
T = Average temperature in °C
The formula is modified further when the average temperature is less than 4°C. The formula is used to calculate the runoff for each month and then the values are added to arrive at the annual runoff.
iii. Rational Formula:
The runoff from a catchment can be estimated by using a rational formula for small catchments as follows:
R = C.A.P
where, R = Runoff in million m3
C = Constant
A = Area in km2
P = Average annual precipitation in meters.
Table 2.6 gives the value of C as suggested by Richard.
The runoff from each catchment area is evaluated separately and then added together to arrive at the total runoff.
iv. Deducting Abstractions from Precipitation:
The runoff can also be estimated by deducting all abstractions from the precipitation. These abstractions are evaporation, surface retention and infiltration; however, it calls for a correct estimation of these abstractions.
Method # 3. Rainfall-Runoff Correlation:
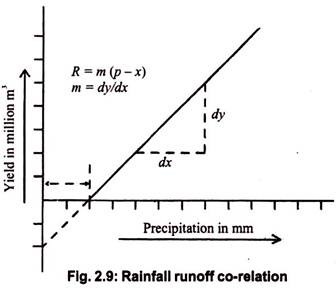
From the data available from past records, a graph can be plotted to correlate runoff and rainfall.
The graph will normally be a straight line having the following equation (Fig. 2.9):
R = m (p – x)
where, R= Runoff in million m3
m = A constant
p = Rainfall in mm
x= Interception of the straight-line relationship on the x-axis.
The relation thus derived will be applicable for a specific catchment and is normally not used for other catchment areas. There are several changes carried out by humans every year and the relation has to be modified every year to account for them. However, it gives a rough, estimate.


