ADVERTISEMENTS:
In this article we will discuss about:- 1. Introduction to Map 2. Types of Maps 3. Importance 4. Directions 5. Contour Lines.
Introduction to Map:
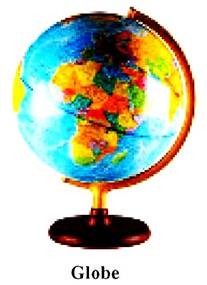
We use globe to understand the actual structure of Earth which represents our planet in right manner but in very small size as compared to its original size. It represents the size, shape, direction, distance and relation between the continents, oceans and other forms found on our Earth.
But we cannot use and carry it everywhere. There are certain difficulties related with its use e.g. large size globe is also not able to provide vast information and more over its formation is also quite tough.
ADVERTISEMENTS:
Map provides the solution of above mentioned problems. Map is a visual representation of an area or selected features of Earth, typically on a flat surface with the help of traditional symbols on the scale which is reduced as compared to actual scale because various types of natural and man-made features are located on Earth and their collective representation is not possible on a single map. An attempt in relation to above mentioned situation will make a map purposeless and unintelligible.
Inspite of this, in present era maps are not only used by army and students of geography. These are also used by Governments, Planners, Industrial, Commerce, Trade Sector etc.
Types of Maps:
Different Types of Maps are designed on the basis of needs of various users:
1. On the Basis of Scale:
ADVERTISEMENTS:
The scale on the map is shown in same ratio proportionate to the actual distance on the Earth. Meaning thereby, a map is just reduced form of Earth or a part of it, which finds its reduction at same proportionate ratio. The relation of scale of some map also relates with the purpose and information of a map. It is purposefully that maps are prepared on bigger or smaller scale.
(a) Land Maps:
Such maps are used for Revenue records by land revenue officials and local government departments. These maps are prepared on large scale such as 1cm: 20 m or 1 cm: 40 m. Very small features such as extents of playgrounds situation of wells, trees and houses etc. are shown in such maps, origin of land use maps is found in France, where Cadasters were prepared in French language means revenue record registers were prepared in French language. These are used by the government for collection of taxes and revenue.
ADVERTISEMENTS:
(b) Physical Map:
Physical maps are prepared for detail conformation about land form, natural traits, light vegetation, drainage pattern and other professional needs on the basis of extensive surveys. Generally these maps are prepared to show 1 inch: 1 mile to 1 inch: 4 mile scales. Apart from geographers such maps are very useful for armed forces and land planners.
(c) Wall Maps:
Such maps are prepared on small scale to show whole of the world, some continents or climate, vegetation, soils, minerals, agriculture, transportation etc. of the world. These maps are used as teaching aids for students in class or labs. Although such maps are prepared on small scale yet related information is printed in large font.
(d) Atlas Maps:
Various maps formed in the form of a book in an order are known as Atlas. As wall maps, these maps are also prepared on small scale and they represent various features of various countries and continents. These are meant for individual use. School Atlases are prepared for the use of students.
These include detailed maps of various regions of countries and maps representing main features of continents are included in these Atlases. Inspite of this, Atlases based on particular subject are also prepared e.g. Population Atlas, Agriculture Atlas, Census Atlas etc. provide information about related topic.
2. On the Basis of Purpose:
These are divided according to the information provided in them.
ADVERTISEMENTS:
Especially natural and cultural maps are categorised as follows:
(a) Natural Maps:
Natural maps show various features related to natural aspects such as:
(i) Relief Maps:
Relief Maps show various land forms according to their classification on a map. Heights of relief, depth, slopes and drainage are commonly shown in such maps.
(ii) Geological Maps:
These are prepared according to the structure of the Rocks on the basis of their classification.
(iii) Soil Maps:
These represent the features of various types of soils and areas where they are found. These maps are very helpful for agriculture sector in particular.
(iv) Climatic Maps:
These maps represent rainfall, temperature, winds and atmospheric pressure according to the season.
(v) Vegetation Maps:
These maps represent the division of Forests, Grass plains, Shrubs etc. Natural vegetation and plantation is also depicted in such maps.
(b) Cultural Maps:
Such maps present various geographic, cultural aspects, such as:
(i) Political Maps:
These show political boundaries of different political regions e.g. country, state, district etc. These are helpful in planning and administrative purposes.
(ii) Historical Maps:
These provide information about the historical feature.
(iii) Strategic Maps:
These help armies in strategic purpose and during war. Information provided by these maps is more accurate and detailed as compare to the commonly used maps.
(iv) Social Maps:
These provide information about the language, religion, tradition etc. about the people of a country or whole world or any part of it.
(v) Classified Maps:
In such maps regional classification of any particular characteristic, which has not been covered above, is shown. Such characteristics may be about any natural or human trait e.g. population, agriculture, industries, rainfall, temperature etc.
Importance of Maps:
Map is an important tool for geographers. It helps in understanding the complications of our large size Earth in an easy way. Obviously single person cannot collect all the information of world himself only. Information about the unseen and distant parts of world presented in the form of pictures, appeal to mind and help to understand the complicated features. Other than of students of Geography, maps are used by various people in different sectors.
Like an international tourist who is not able to speak the language of a particular country in which he is touring, can use a map for his/her destinations. In present global era, international trade has been increased a lot and takes place through sea and airways. Navigation charts play an important role in the movement of ships.
During war inspite of armed strength of armed forces depends on strategy of war and information about the areas of enemies, barriers and danger. In such situation importance of relief maps is very clear to us. Large countries like India depend upon natural resources, adequate use of these for administrative and planning purposes; maps provide information about the situation and condition of these resources. Maps are used upto great extent by large business houses, who run their trade in different countries of world.
Directions of Maps:
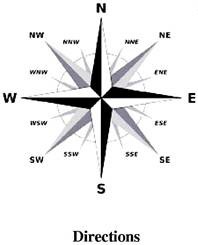
Directions are very important. Knowledge about directions is necessary for making maps and also for reading them, especially for the army during the war.
Mainly we get information about directions from the rotation of Earth. As we all know that sun rises in East and sets in West. Hence North and South directions are diagonally at right angles to East West line. Principally any line on the Earth which touches Northern most part of Axis, points towards North. Same way any line touching southernmost part of axis points towards South.
So, out of four directions East, West, North, South, if we know about one direction then we can find out others also. In ancient times travellers and sailors were able to find their routes without compass in sea, forests and deserts.
Methods to Find out North Direction:
In map and field ‘North’ direction is easiest to locate because we know that longitudes are the semi circles which join the North and South poles. In maps these are shown as vertical lines and they point towards North in a map. So the upper part of the map depicts north and lower part depicts south. Its right hand side is east and left side is west.
These are several ways which have been used to find out ‘North’ direction in the open areas in India.
1. Pole Star:
This is the only star which is present above the North Pole of Earth. It does not change its position as other stars and seems to be still. With the help of two groups of stars. We can locate the pole star.
First group comprises seven stars, which is also known as ‘SaptaRishi’ The bright star present at the distance of 41/2 times the distance between the first two stars (Pointers) of this group.
Second group is present in the opposite direction of ‘SaptaRishi’ and it looks likes Alphabet ‘W’ and have five stars. It’s also known as ‘Kaemeopia’. This method is not useful during day and cloudy nights.
2. With the Help of Watch:
In this method clock is placed on a leveled surface and the arm representing hours is pointed towards Sun. For this purpose we can use a pin, its shadow tells us about the direction of Sun. Now half the angle formed by its hour hands position pointing towards 12, shall indicates toward South direction and if we extend it backwards then that line shall point towards North.
3. With the Help of a Stick:
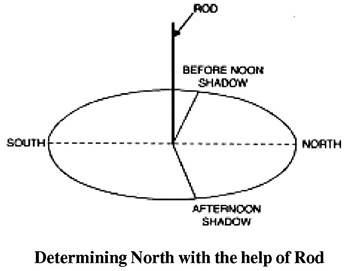
Place a stick upright into the Earth on a sunny day before noon. Sunlight must fall on that place for whole day without any obstacle. Taking shadow of the stick as radius and stick as centre draw/mark a circle. Suppose this circle meets the shadow at point ‘A’ Shadow will decrease till noon and start increasing in afternoon. Again the shadow will touch the circle oat another point mark it as ‘B’. Centre of the circle and these two points make an angle. By-section of this angle into half shall points toward north.
Orientation of Local Map in the Field:
The correct use and the method of obtaining or gaining maximum information from a map depend upon the coordination of map with field and actual places situated on Earth. We should be efficient in finding directions so that we would be able to find North direction while moving in real world. Second step is to equate the north shown on the map and actual North of the Earth. This activity shall help us in understanding the information correctly, shown in local map.
Third stage is to select that important feature in the local map which we can locate originally also. Such features may be a bridge, a road, railway line, canal, any factory, high power line, a ridge etc. We can easily locate our location if we find more than one features on a local map and in original as well we can draw an angular direction from the original feature on the map. Use of scale can make us aware of original distance also.
Representing Earth or its any part on paper is known as a map. Symbols are important part of any map. Various natural and human characteristics that are found on land or relief are shown by some identical set of symbols on a map. Such symbols are known as traditional or cultural symbols.
Knowledge of these symbols is an identity of a good map curator because reading and understanding the information provided in map is an art. History has also proved that those countries achieved which expertise in making and using the maps and kept themselves well informed about the forces, relief and resources of other nations, got success also.
Methods of Showing Relief on Maps:
Surface of our Earth is not leveled Mountains, Plateaus and Plains are situated on it and these three important parts are also not similar. Collectively these low and high regions of earth are known as relief. Maps which represent these different aspects of land surface are known as relief maps.
To represent/show the relief on maps various methods have been used e.g. Hachures, Hill shading, Relief colours Bench Mark, Spot height and Contour Lines. Among all these contour lines are used mostly.
Contour Lines in Maps:
Contour lines are the imaginary lines which are used to connect the areas situated at the similar height from the sea level. This is the best method of understand the details of Relief and variation between slopes of particular region.
In Ancient times survey method was used to measure the height and collect information about different places. On the basis of collected data and information. Relief maps were prepared. These days, information is collected about every region with the help of aeroplanes and satellites by using Aerial photography and remote sensing techniques. With the help of this information Relief Maps are prepared by using ‘Photogrammetry’ which is an advance technology.
Commonly contour lines are drawn according to the relief at the gap of 20, 50 or 100 meters. The gap depends on the slope of that region. Low slope is represented by more gaps and for steep gradient gap between lines is reduced.
Characteristics of Contour Lines:
(1) Height of all the regions is same at one contour line.
(2) Shape of contour lines depends on the height and slope of particular region.
(3) They extend from one end to another circular shape. They never start or end abruptly.
(4) Contour lines drawn at small gaps show steep slope and lines drawn at large gap represent slow slope.
(5) Commonly contour Lines do not intersect except in the case of cliff or waterfall.
Drawing-Contour Lines:
Enjoining places with same height by drawing contour lines on a given map is called drawing a contour map or interpothen of contours.
While drawing contours, following points are to be kept in mind:
(1) Meaningful contours maps may be drawn if height of maximum places is provided in a map.
(2) Note the highest and lowest point on the map.
(3) Note the difference between the highest and lowest point because on the basis of this we have to decide the range of contours lines.
(4) The interval of contour lines should be at some whole number such as 10, 20, 30, 50 or 100 meters.
(5) Value of contour lines are specified keeping in mind range and interval
(6) List of all contour with lead height be drawn and then the value in ascending order be drawn, reaching to the contour with maximum height.
(7) To find out exact position of contour between two heights, connect two heights with a line and divide it into two equal parts.
Drawing of a Cross Section or Profile from Contours:
Vertical front view of a relief feature is called a cross section profile from contours. This is same as an apple is cut in two with the help of a knife and it’s both parts from cut line shall be taken as cross section profile.
Drawing of cross section is necessary to understand the landforms shown on map. It helps in identifying height, depth and slope in a cross section.
Following methods are used to prepare a cross section:
(a) Right Angle Method:
This is a simple method. As shown in example, a right angled line is to be drawn which passes through all the contours. This A’-B’ line intersects al the contours at points A,C,E,G,I,J,H,F,D&B respectively. Draw another line A”-B” parallel to A’ -B’ at some distance. Draw two right angled lines enjoining A’ -B’ with A”-B”.
Extend these A’ – B’ and A”- B” lines more than lowest rated contour extents as shown in the figure highest valued contour here in the given figure is of 500 meters and shown between I & J points but still height between these two points may be lower than 500 meters but certainly more than 400 meters.
Now draw perpendiculars from A,C,E,G,I,J,H,F,D & B down wards N,O,P,Q,R,S,T,U,W respectively. Enjoin these points through free hand curves.
Point to be noted here is that horizontal scale in such a cross section is maintained while vertical scale is extended 5 times to 10 times so that relief may be represented in clear way.
The cross section shown above in showing a hill in North-south direction while we may prepare such cross section from east-west.
Identification of Simple Relief Features from a Contour Map:
With the help of contours we can identify almost every type of land form found on our mother earth.
Detail about some of the important land forms is given below:
1. Slope:
An angle formed horizontally with plane relief is called slope. Information about slopes is very important for the study of land forms.
Commonly we can divide slopes into different types:
a. Gentle Slope:
When the contours are situated at large distance in a region of a map and variation in height because of distance is less than 1/10 to 6°. This type of slope is known as Normal slope.
b. Steep Slope:
Abrupt change in the height of relief is represented by contours drawn near to each other. It is different from 1/10 and 6°.
c. Concave Slope:
When a lower part of region has normal slope and upper part has steep slope. Contours of lower part have been drawn at large gap and in upper part these are draw close to each other.
2. Volcanic Mountain Peak:
The contour map of volcanic Mountain to similar to that of conical mountain in the context that contour lines are marked at regular intervals. As the volcanic eruptions create a dent at the top of mountain, called as crater, central contour shows its value less than that of its adjoining contour value. It means that contour value is lesser at interior most point which rises as we go outer and then starts decreasing as we proceed further.
3. Lake:
Contour map of a water body known as lake or whatever is similar to that of a conical mountain volcanic mountain but value of contours goes on decreasing as we proceed towards central point or interiors.
4. Valley:
Valley is a low region situated between two mountains formed by the erosion process of Glacier or River.
(a) ‘U’ Shape Valley:
In high mountainous regions valleys are formed by the erosion process of Glaciers. The valley is formed by the erosion process of Glaciers. The Valley is wide with steep slopes and they look like Alphabet ‘U’.
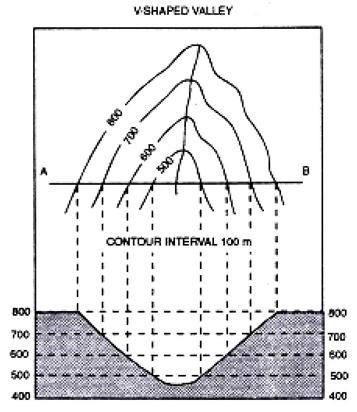
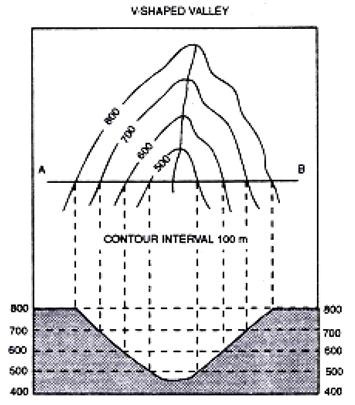
(b) ‘V’ Shape Valley:
‘V’ shape valleys are formed in mountaineous regions due to erosion process of rivers. Contour maps of such valleys show increasing value of outer contours and at regular intervals.
(c) Gorge:
Gorges are formed in high mountains, having hard rocks. Erosion is higher due to vertical flow of rivers which results in the formation of deep and narrow valleys. These valleys have steep sides.
5. Waterfall:
When a river falls from a very steep height in any mountainous region, the form is called water fall. Cross section or contour map of water falls shows intersecting contours on a map.
6. Cliff:
In coastal areas, the slope of mountainous region adjoining the sea looks steep due to erosional process of waves. Contour maps of cliff region also intersect and hence these maps show intersecting contour lines.

